I have been building Nephtys for months and have never written a word about it here. This is that article, and it opens with the least flattering thing I know about the project.
A short paper on Nephtys was peer-reviewed and accepted at IEEE UIC 2026. One reviewer made an observation I could not argue with: the paper described a connector designed for edge deployment, and every number in it came from a laptop. Nothing had ever been measured on edge hardware.
So I bought a Raspberry Pi 5 and a smart plug, and I ran the comparison properly.
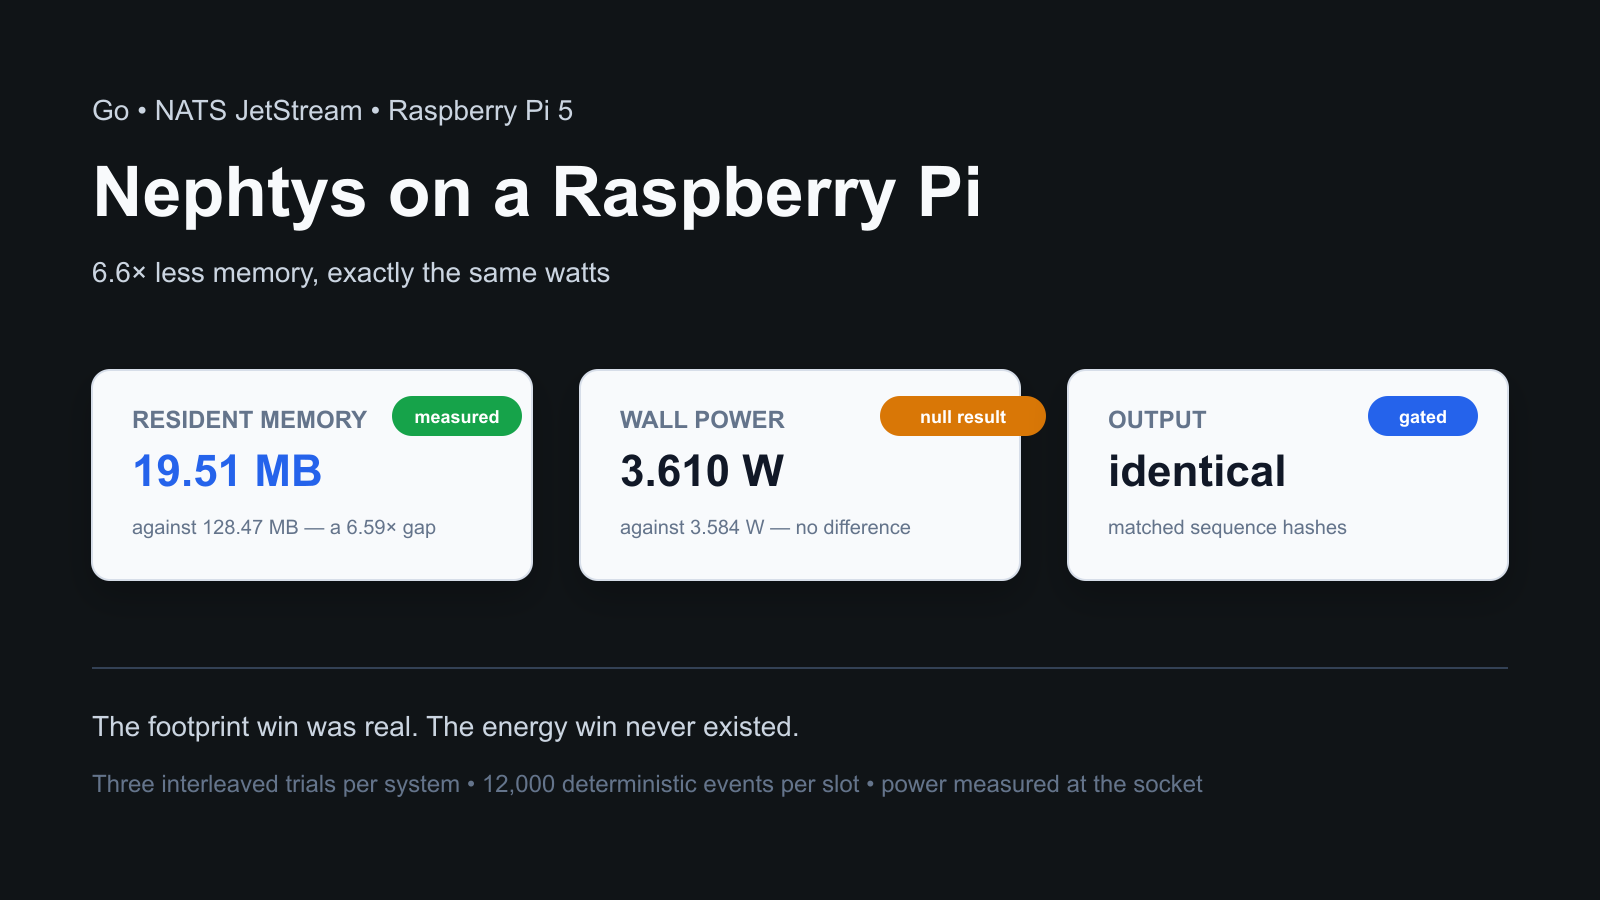
The memory result reproduced and got better: 19.51 MB against Node-RED’s 128.47 MB, a 6.59× gap, with byte-identical output. The energy result is the interesting one. There isn’t one. On the same board, running the same workload, the two systems drew the same power — and if you insist on a direction, Nephtys drew 0.7 % more.

That null result is worth more to me than the memory number, because the memory number is the one I already believed.
What Nephtys is
It is also, for the record, my first serious Go project. I started it to learn the language properly on something I actually wanted to exist, and I would not have predicted any of what follows — peer review, a wall meter, or a result that contradicted me.
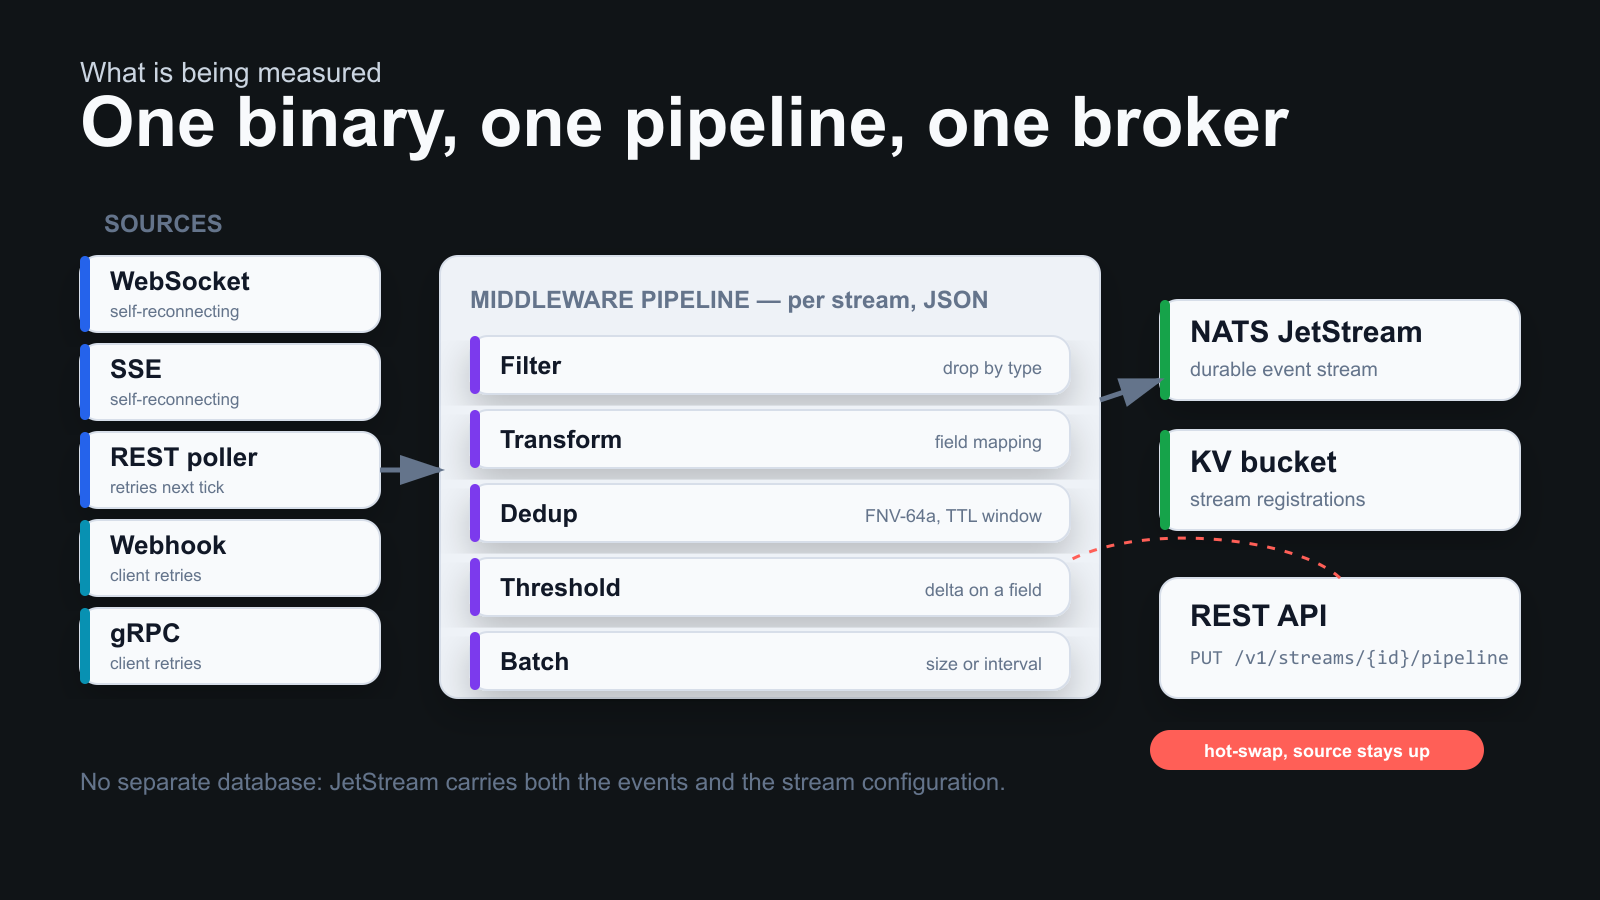
Nephtys is a single Go binary that ingests real-time streams and publishes normalised events to NATS JetStream. It speaks WebSocket, SSE, REST polling, inbound webhooks and gRPC. The WebSocket and SSE connectors reconnect on their own with exponential backoff; REST polling retries on its next tick; the inbound ones delegate retry to whoever is calling them, because they accept connections rather than open them.
Between a source and the broker sits a per-stream middleware pipeline — filter, transform, deduplicate, threshold, batch — configured as JSON attached to the stream registration. The point of the pipeline is to throw work away as early as possible, at the gateway, so the constrained link upstream carries less.
There is no database. JetStream holds the events and the stream configuration, in a
key-value bucket, so a restart recovers its connectors without any other stateful
dependency. Pipelines can be replaced at runtime through a PUT, behind an
atomic.Pointer, so the swap is lock-free and the source connection never drops.
The whole experiment is one registration:
{
  "id": "compare-nephtys",
  "kind": "websocket",
  "url": "ws://host:9091/ws",
  "topic": "nephtys.stream.compare.nephtys",
  "pipeline": {
    "transform": {"mapping": {"station": "station_id", "pm25": "pm25"}},
    "dedup": {"enabled": true, "cache_size": 500, "ttl": "30s"},
    "threshold": {"enabled": true, "path": "pm25", "delta": 1.0},
    "batch": {"enabled": true, "max_batch_size": 50, "flush_interval": "5s"}
  }
}
The claim I was actually testing
On my laptop, against an equivalent Node-RED flow built from core nodes, Nephtys used 19.14 ± 0.07 MB of resident memory to Node-RED’s 109.60 ± 0.40 MB, and both produced identical output on identical input.
Everyone who reads that — including me, for a while — completes the sentence the same way: so it will use less power on a small board. That inference is doing a lot of unearned work. A footprint is a static property; power is a rate. The one only implies the other if memory occupancy is what the hardware is spending its energy on. On a Raspberry Pi at a modest event rate, it very much is not.
That completion is the hypothesis this experiment exists to test, and it failed.
Building a comparison that could fail
The temptation with your own project is to build a benchmark it wins. The defence is to decide the invalidation conditions before looking at any numbers.
Equivalence comes first, because a performance comparison between two systems doing different work is meaningless however carefully you measure it. Both systems receive the same deterministic 12,000-event sequence from a seeded simulator. A neutral NATS subscriber consumes both outputs, normalises the envelopes, and hashes the retained-event sequence in a timestamp-independent way. If the two hashes differ, the run is thrown away — no exceptions, no interpretation.
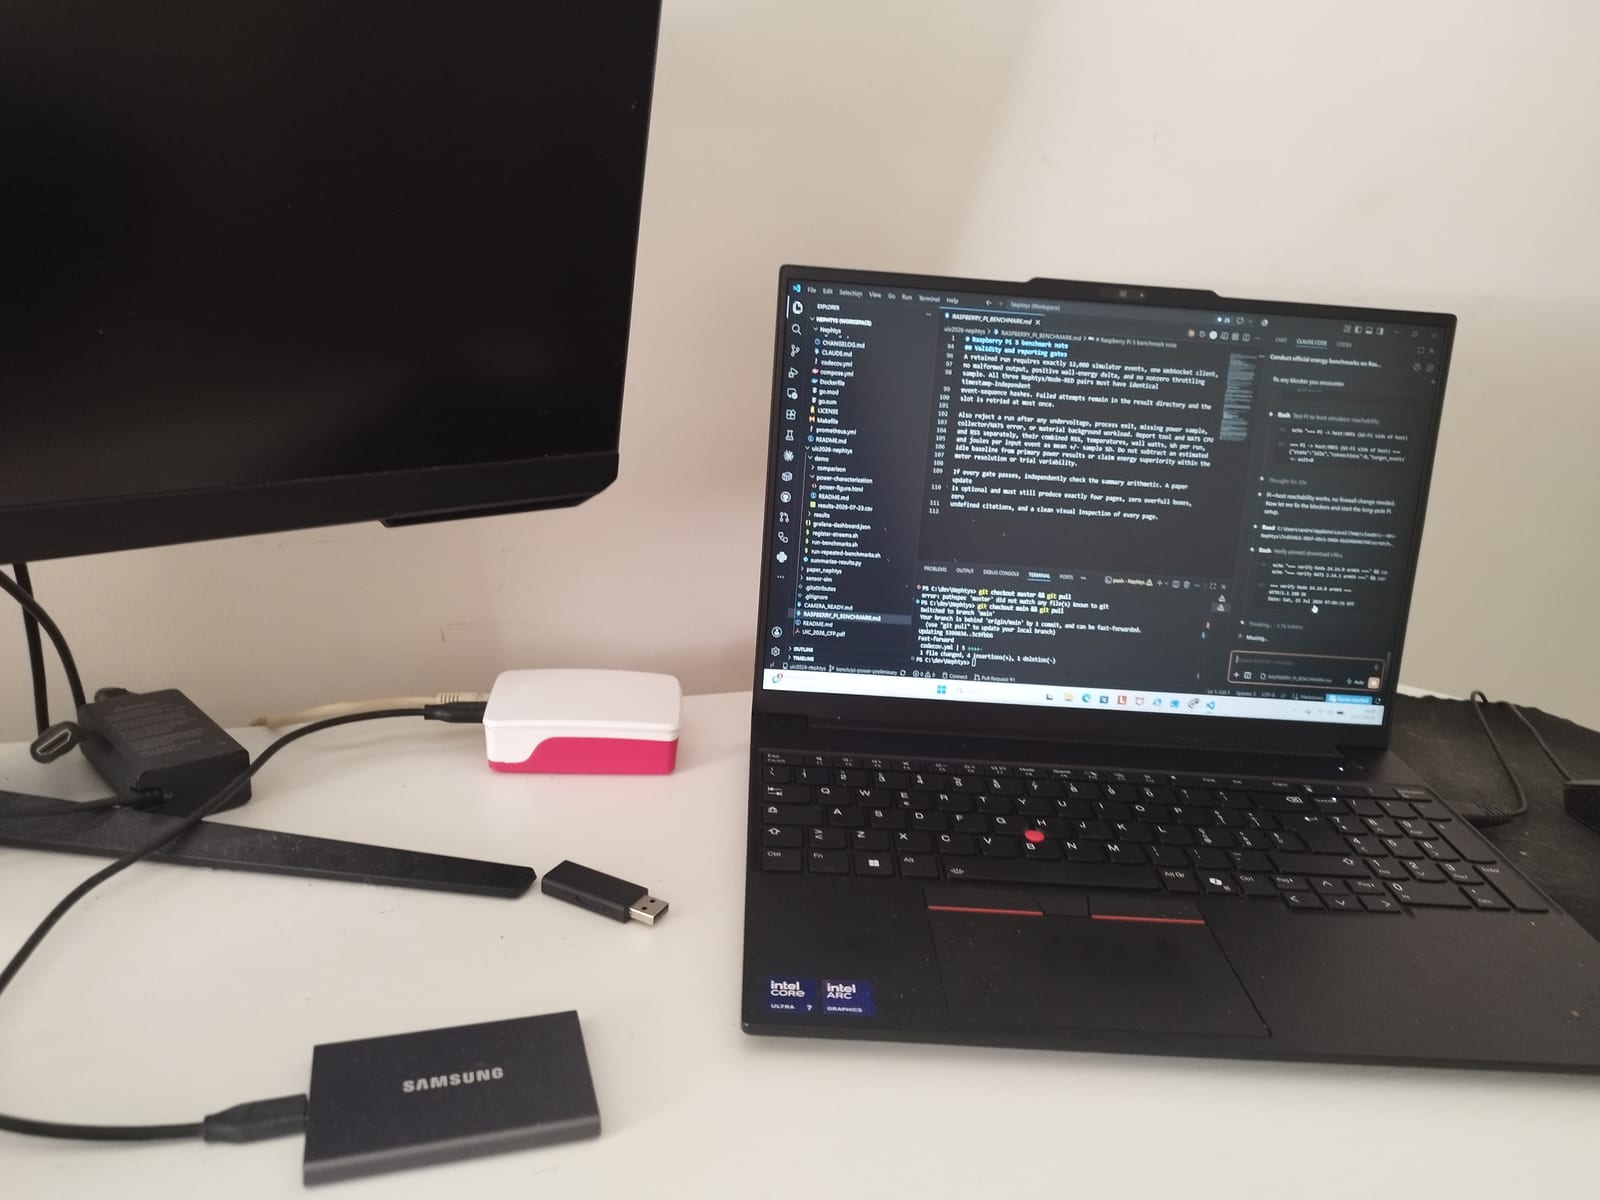
Then the operational rules. Three trials per system, interleaved rather than run back-to-back, so thermal drift and background noise cannot land entirely on one system. Power measured at the mains socket, so the official supply’s conversion losses are inside the number and no idle baseline gets quietly subtracted. The meter polled from the orchestrating laptop and never from the Pi, because sampling the device under test adds load to the thing you are measuring.
And five gates, any one of which fails a slot: exactly 12,000 events, exactly one WebSocket client, no throttling sample, a positive wall-energy delta, and matching sequence hashes.
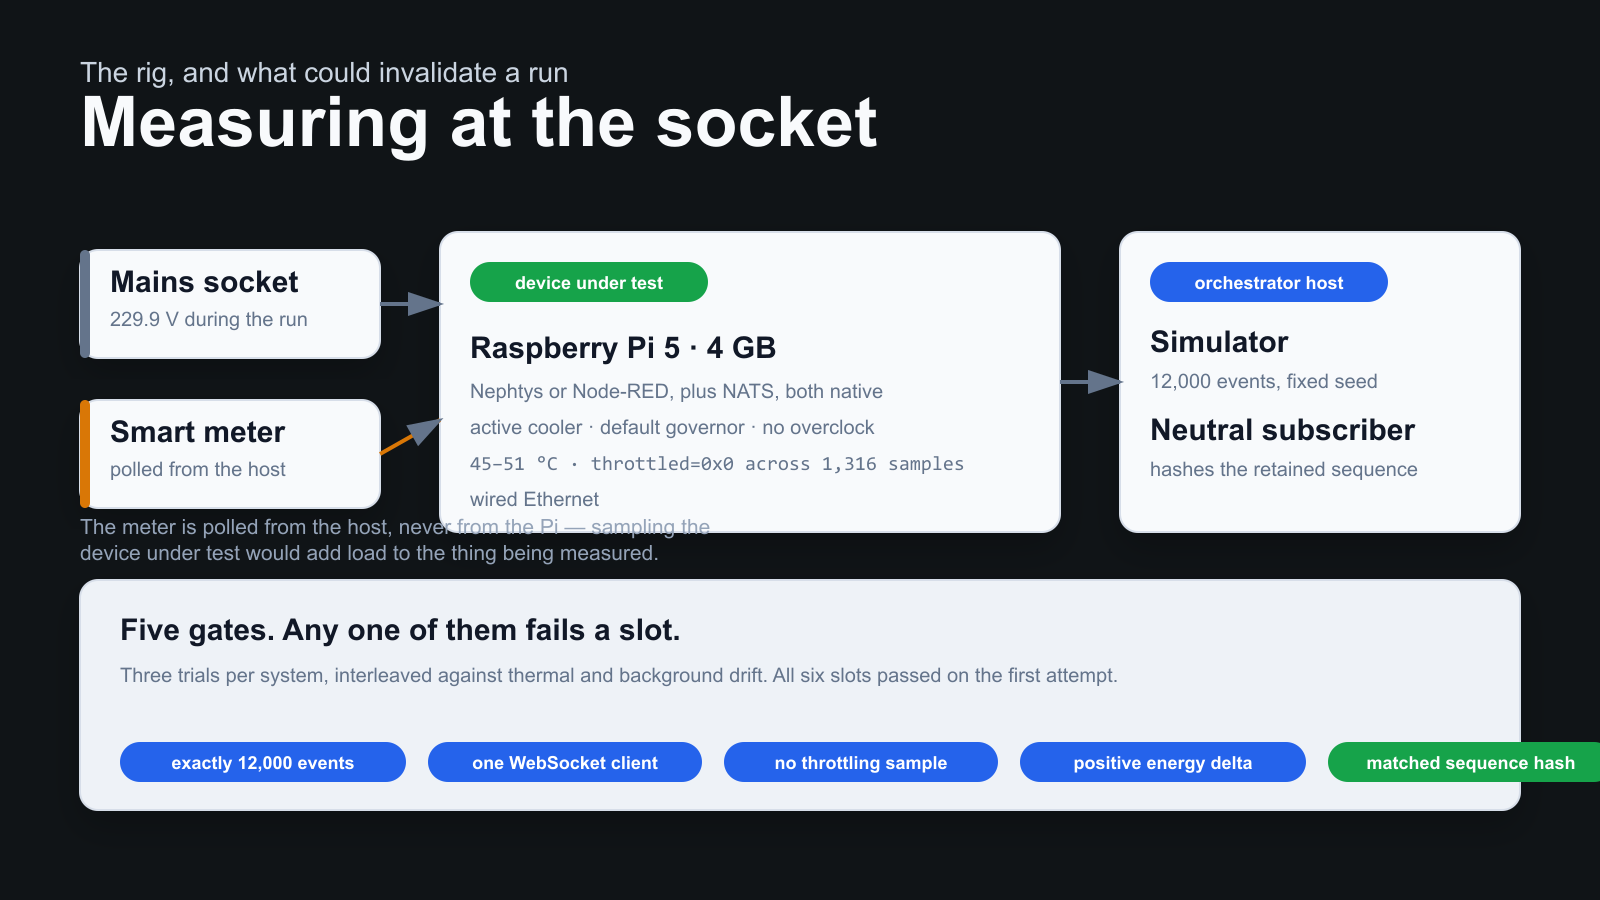
All six slots passed on the first attempt. The SoC never throttled — throttled=0x0 across
all 1,316 samples, 45–51 °C under the active cooler. Achieved throughput was 40.01 to
40.04 events per second, which is the intended load, not a saturation test.
Three ways the measurement lied to me
This is the part I would have wanted to read before starting.
The meter accumulates energy in blocks. The Shelly plug exposes a cumulative energy register, which is the obvious thing to read. It does not increase smoothly. It advances in discrete steps of 0.206 Wh — I counted eleven of them across the session — which at ~3.6 W is about three and a half minutes of energy arriving at once. A five-minute measurement slot accrues roughly 0.31 Wh in total. So a per-slot register delta is quantised at about two thirds of the quantity being measured, and depending on where the boundaries fall it can legitimately read 0.000 Wh on a perfectly good run.
The vendor’s own app shows it plainly. This is the meter’s energy counter over a day: flat, then a step, then a jump, then a plateau. Nothing about the load looked like that.
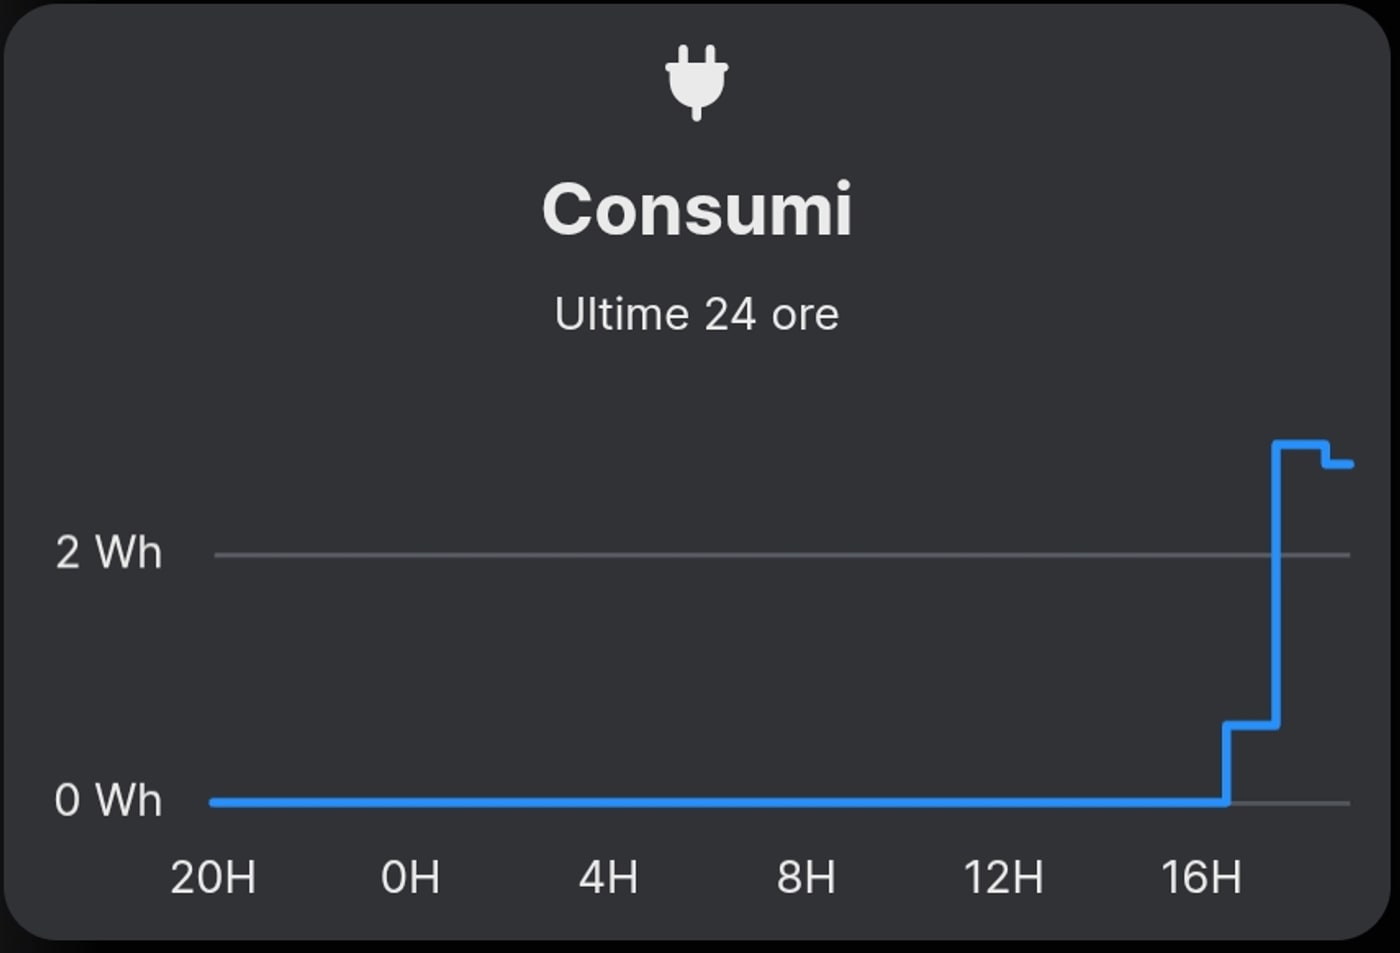
So I stopped reading the register and integrated the meter’s instantaneous power reading on the host instead, roughly every 1.4 seconds, keeping the register as a long-window cross-check. Over the whole session the register advanced 2.273 Wh against 2.1165 Wh integrated — agreement within one of its own 0.206 Wh blocks, which is as well as it can possibly agree.
A locale ate my milliseconds. The sampler carried the previous sample’s timestamp
between invocations as an ISO-8601 string. PowerShell’s ConvertFrom-Json helpfully
rehydrates such a string into a [datetime], and coercing that back to a string for
parsing renders it in this machine’s it-IT short format — which has no sub-second
component. Every interval silently gained the discarded fraction, about half a second on
1.4-second samples. Intervals summed to 931 seconds across a window that really lasted 716.
Integrated energy came out roughly 30 % high.
Nothing about the resulting numbers looked wrong. They were plausible, self-consistent, and inflated. What caught it was arithmetic that had to agree and didn’t: 0.4231 Wh over 306 seconds implies 4.97 W, while the power samples over that same window averaged 3.687 W. Those are two paths to one quantity, and they disagreed by exactly the amount the bug introduced.
The lesson is not “beware locale bugs”. It is that every headline number needs a second, independent path to it, or you will publish whatever your first path happens to produce.
Time is now carried as integer ticks, which round-trip through JSON exactly. After the fix the two paths agree to 0.07 %.
An ssh call hung after finishing. The orchestrator samples the Pi over SSH once per
interval. Windows ssh.exe without -n forwards its inherited stdin to the remote command;
when the orchestrator runs detached with redirected output, that handle never reaches EOF,
and ssh can block indefinitely after the remote command has already exited. It stalled one
slot for eleven minutes. Had it happened inside the sampling loop rather than between
slots, it would have quietly corrupted a run instead of merely delaying one.
I threw away the affected partial run and re-ran the whole benchmark from scratch. That is the boring, expensive, correct move, and it is the reason I trust what follows.
The result
Three valid trials per system, mean ± sample standard deviation:
- Resident memory, connector only — 19.51 ± 0.07 MB against 128.47 ± 0.44 MB. A 6.59× gap.
- Connector plus NATS — 38.85 ± 0.10 MB against 147.07 ± 0.48 MB. 3.79×.
- CPU, where 100 % is one core — 0.32 ± 0.00 % against 0.72 ± 0.01 %.
- Latency p95 — 2009 ± 1 ms against 2013 ± 1 ms. Both dominated by the batching policy.
- Wall power, whole board — 3.610 ± 0.005 W against 3.584 ± 0.014 W.
- Energy per event — 92.2 ± 0.3 mJ against 91.5 ± 0.4 mJ.
Output was identical in every slot: 12,000 events in, 7,733 surviving deduplication and thresholding, compacted into 155 batches — 67.30 % fewer bytes and 98.71 % fewer messages, for both systems, on both platforms. All six slots produced one single sequence hash. The pipelines are equivalent across architectures, not merely similar.
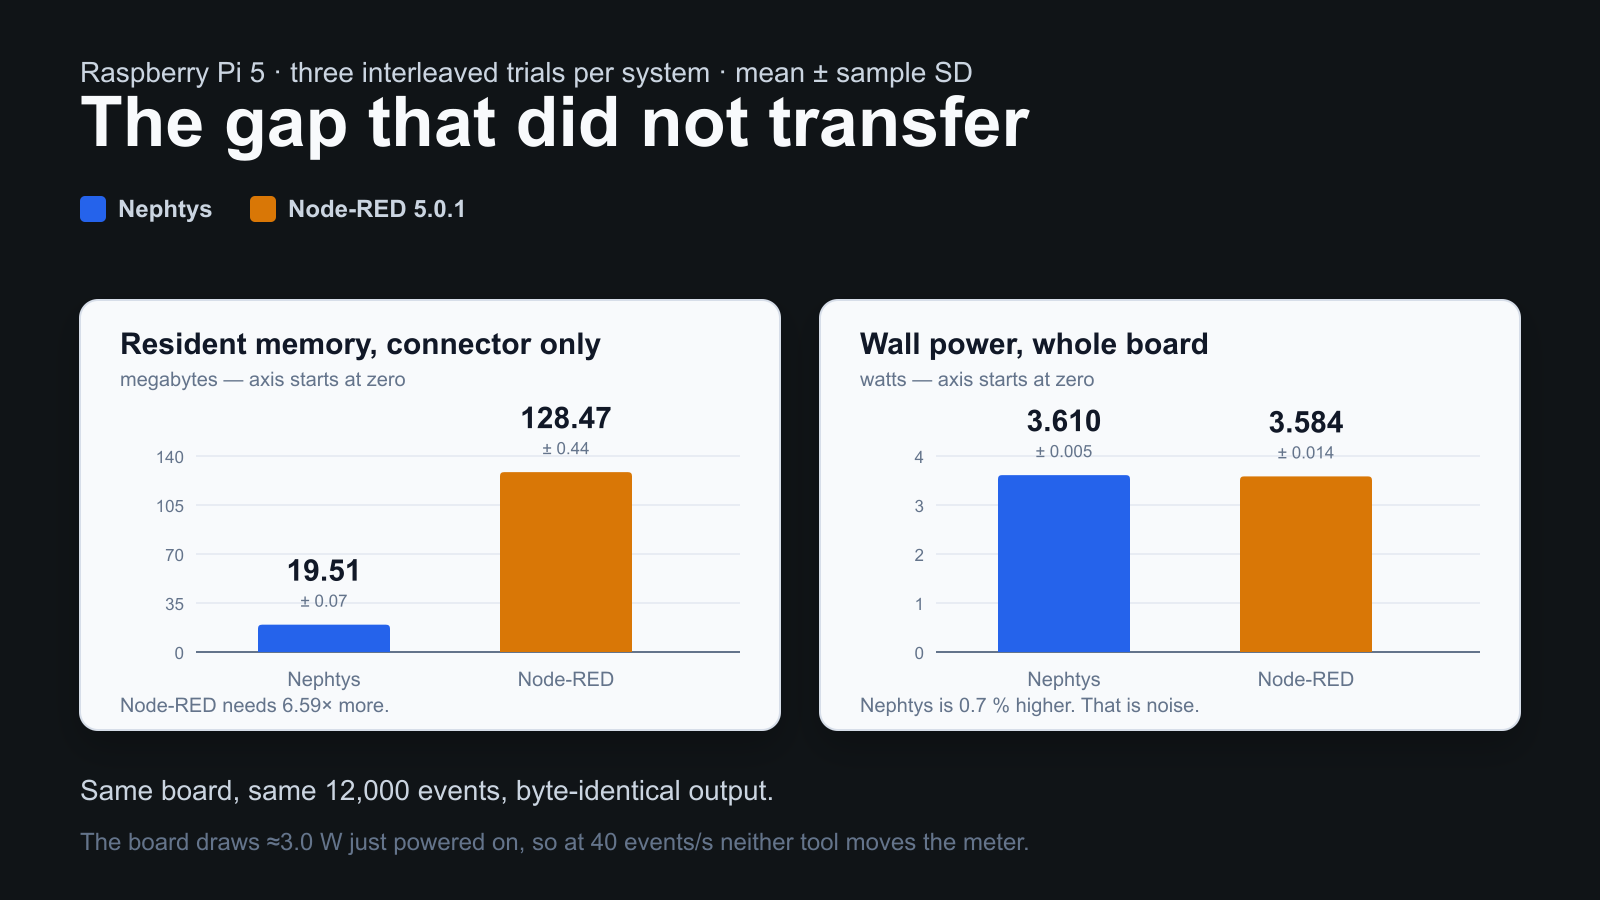
The memory gap actually widened on ARM64. Node-RED costs 17.2 % more resident memory there than on x86-64; Nephtys is essentially unchanged, at +1.9 %.
And the power is flat. Nephtys measured 0.025 W higher — 0.7 %, the opposite sign to the memory result, and below one quantisation step of the meter’s own power reading. I am not going to dress that up as a win in either direction. It is a null result.
The reason is not subtle once you look for it. The board draws about 3.0 W sitting there doing nothing; an earlier exploratory sweep put the bare OS at 3.096 W and adding idle NATS and Nephtys changed it by 3 mW. At 40 events per second, the work both tools perform is a rounding error on top of a fixed hardware cost. The same sweep found the marginal cost of an event falling from 64 mJ at 10 events/s to 1.3 mJ at 1000 events/s — the processing term only becomes visible far above the load in this paper.
So what is the footprint for?
If it is not power, it is capacity — and on this class of hardware that is not a consolation prize.
The Pi has 4 GB. The difference between a connector resident in 19 MB and one resident in 128 MB is the difference between an ingestion gateway that leaves the board free for something else — a local inference model, a buffer deep enough to ride out a long uplink outage, a second and third stream — and one that has already spent a visible share of the machine on being present. 0.72 % of one core against 0.32 % says something similar about thermal and scheduling headroom.
That is a real engineering claim, it is supported by the measurement, and it is narrower than the one I would have made if I had never plugged in the meter.
What I would tell myself before starting
Measure the thing you claim, not the thing that is easy to measure. Resident memory is trivially observable and I had it for free. Wall power required buying hardware, and it is the number that actually bears on “suitable for edge deployment”.
A footprint is not an energy figure. They are different physical quantities and the bridge between them is an assumption about where the energy is going. On a device with a 3 W floor and a light workload, that assumption is just false.
Give every headline number two independent paths. Both bugs that mattered were caught by disagreement between two ways of computing the same thing, not by inspection. A single well-behaved-looking pipeline will hand you a wrong answer with total confidence.
Publish the deviations. My run used a desktop OS image rather than Lite, a USB SSD rather than a microSD, an uncalibrated consumer meter, and a Wi-Fi link on the orchestrating laptop. None of it changes the comparison, because all of it is common to both systems in the same interleaved session — but a reader deserves to decide that for themselves, so the result directory says so in full.
A reviewer asking for evidence you do not have is doing you a favour. The honest answer weakened a claim I liked and produced a sharper paper. I would rather find that out from a reviewer than from someone who deployed it.
On which note: my thanks to the anonymous reviewers, whose insistence on real hardware is the only reason this article contains a measurement instead of an assumption, and to Prof. Fortino of Università della Calabria, who handled the review of the paper. The conclusions here, including the uncomfortable one, are mine alone.
Where the work is
Nephtys is at AndreaBozzo/Nephtys. The benchmark
protocol, the orchestrator, the raw per-second samples, per-slot logs, the recorded
deviations and the gate record are in the companion repository at
AndreaBozzo/uic2026-nephtys, under
demo/comparison/results/pi-20260725T075732Z/. The summary arithmetic there has been
recomputed independently from the raw counters; all 24 metrics match.
The obvious next experiment is the one this run cannot do: an event-rate sweep on the board, to find where the processing term finally overtakes the idle floor. Somewhere above 40 events per second the two curves must separate. I do not know where, and I am not going to guess in public — that is the whole point of the last three weeks.